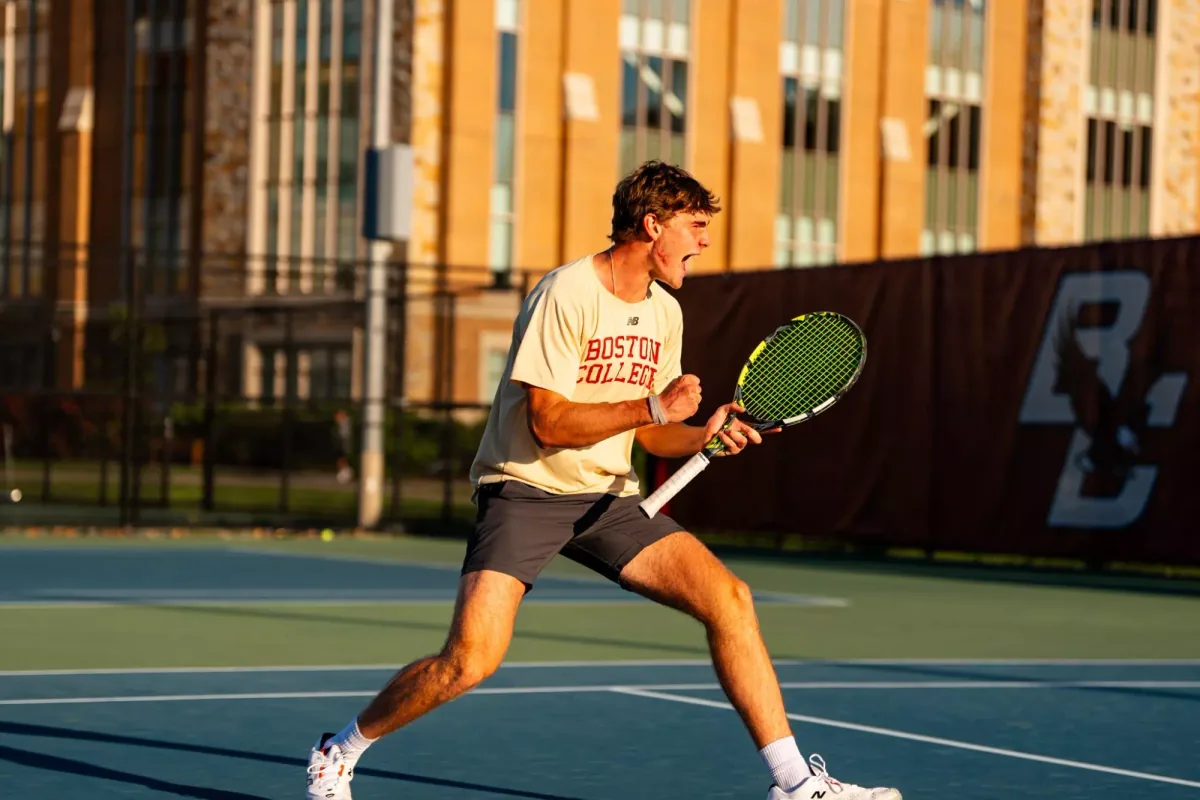
By GetRecruited
Introduction
For most families weighing college tennis, the opening question isn't where a son can play — it's what playing there will cost. That instinct is sound. Across all 861 men's programs, the net price (what a family actually pays each year after grants and aid) runs from a couple of thousand dollars to north of forty thousand, and the figure tracks the name on the racquet bag far less than you'd guess.
Cost is the right place to start, but it's only the first of several questions, and answering it well means seeing how the rest connect to it. Those 861 programs sit across five divisions and all 50 states. They vary in how big a squad they carry, how many spots come open in a given year, how many of their students finish a degree, what those graduates go on to earn, and how much each program spends on its players. Reading those pieces together is what turns a hopeful guess into a list you can act on.
The dozen schools on the tip of your tongue are real, but they're a fraction of where college tennis is actually played and recruited. The program that fits your son's game, his grades, and your budget is far more likely to be one you'd have to go and find.
Best colleges
Search for best tennis colleges and you'll get a ranking. Recruiting doesn't work that way. The best tennis college is the one where your level, your grades, your budget, and a real shot at playing time all line up at once — and that school is different for every recruit.
So treat the sections below as filters, not a leaderboard. Each one sorts the field by a single thing that decides fit — how the divisions break down, how fast rosters turn over, what the degree is worth, and what a year really costs — and the full men's tennis directory lets you weigh them against your own priorities, program by program.
Seeing all 861 programs at once is useful, but your family only needs the handful that fit. Build a recruiting plan that narrows this field to the schools worth contacting — by division, by region, by cost, and by the kind of degree you want.
Landscape
The game runs well past Division I.
College tennis isn't a D1 sport with a few smaller circuits tacked on. Division III is the largest single group, with 298 programs — 35% of the sport. Division I comes next at 237 (28%), then Division II at 143 (17%). The NAIA, a separate association built mostly of smaller private colleges, adds 97 (11%), and two-year junior colleges (JUCO) account for the final 86 (10%).
Put plainly: roughly seven in ten men's tennis programs play somewhere other than Division I. A family that starts and finishes with the ranked teams on TV is looking at about a quarter of the places a player can actually compete. The other 624 programs are where the bulk of recruiting happens — and where a player who isn't a blue-chip prospect has genuine room to land.
Getting the shape of the sport straight is the first move, because the right level for a given player often sits a notch above or below where he first pictured himself. A list built across divisions, not within one, almost always serves a recruit better.
Tennis programs follow the colleges, not the climate. California and Pennsylvania tie for the lead at 67 programs each, then New York with 58, Texas with 42, and Illinois with 41. North Carolina (34), Indiana, and Massachusetts (30 each) fill out the densest states.
The mix is the telling part: the leaders pair sunbelt states with cold ones. Pennsylvania, New York, Illinois, Indiana, and Massachusetts aren't tennis-vacation country — they're packed with the small and mid-size colleges that field teams and practice indoors all winter. The top five states hold 32% of all programs between them, so opportunity concentrates without becoming a southern monopoly. For most families, that means workable programs sit within a few hours of home, not only across the country.
Roster size
Six on the ladder, and a senior leaves each year.
Tennis settles a team match by stacking individual results — singles lines and doubles pairings — so a roster reads as a ranked ladder, not a deep bench. Across the sport, squads average about 10.9 players. Division I sits at 10, Division II at 11, Division III at 11.6, and the NAIA at 12.1. Junior colleges run the leanest, around 9.2.
A small squad can look like a sealed door. Turnover is the better way to read it: a senior class leaves each year and its lines come open. Working from average roster sizes, we estimate a typical D1 program has about 2.5 spots to fill annually, D2 around 2.8, D3 about 2.9, and the NAIA roughly 3. Junior colleges, on a two-year cycle, churn fastest — close to 4.6 openings a program each year.
Totaled up, the field opens wider than any one roster suggests. We estimate Division III alone offers around 868 openings a year, with D1 near 590, JUCO about 397, D2 around 394, and the NAIA near 294. One caveat worth stating plainly: an average roster size is not a guarantee of an open line — transfers, redshirts, and a coach's plans all move the math. Even so, the direction is clear, and it matches the rest of the picture: the spots are there for a family willing to look across the whole sport rather than the top of it.
| Division | Programs | Avg roster | Open spots, total | Open spots, pr. program |
|---|---|---|---|---|
| D1 | 237 | 10.0 | 590/year | 2.5/year |
| D2 | 143 | 11.0 | 394/year | 2.8/year |
| D3 | 298 | 11.6 | 868/year | 2.9/year |
| NAIA | 97 | 12.1 | 294/year | 3.0/year |
| JUCO | 86 | 9.2 | 397/year | 4.6/year |
The level averages hide a wide spread. Within a single division, rosters run from squads carrying 40-plus (Gustavus Adolphus at D3, Belmont Abbey at D2) down to ones with three to five players (King at D2, several at D1). A deep roster isn't extra opportunity — on a six-line ladder it's more players stacked ahead of you. Toggle between deepest and leanest, then check a program's size against the lines its seniors are leaving open.
Best tennis roster opportunities, by division
| Program | Roster |
|---|---|
| Wagner College Northeast Conference | 21 |
| Wake Forest University Atlantic Coast Conference | 19 |
| Texas A&M University-College Station Southeastern Conference | 17 |
| Fairleigh Dickinson University-Metropolitan Campus Northeast Conference | 16 |
| Vanderbilt University Southeastern Conference | 16 |
| Loyola University Maryland Patriot League | 15 |
| Citadel Military College of South Carolina Southern Conference | 15 |
| Southern Methodist University Atlantic Coast Conference | 15 |
| Samford University Southern Conference | 14 |
| Mount St. Mary's University Metro Atlantic Athletic Conference | 14 |
Academics
A degree worth the four years sits in every draw.
Two numbers carry most of the academic story. The graduation rate is the share of students who finish their degree; six-year median earnings is roughly what graduates make a few years after starting college. On graduation, Division I leads on average at 70%, with Division III close behind at 66%, then D2 at 51%, the NAIA at 47%, and JUCO at 38% — a gap that says as much about the two-year, transfer-out nature of junior college as it does about the schools.
Averages bury the better news: the academic high end isn't penned into one division. In Division I, the Ivy League stands apart — Harvard graduates 98% of its students with median earnings of $99,572, Penn 97% at $90,555, and Columbia 96% at $88,535. Their acceptance rates (how hard it is to get in) run 4 to 5%, so tennis is one piece of a very tight admissions puzzle.
Move to Division III and the ceiling is every bit as high. Caltech graduates 94% of students at $132,140 in median earnings and admits just 3% of applicants; MIT graduates 96% at $131,633; Johns Hopkins 94% at $86,306. The pattern carries into the other divisions, too — Hillsdale College in D2 graduates 90% of its students, and Emory's Oxford College, a junior-college entry point, graduates 94%. For a family, the lesson is direct: the division label says almost nothing about the worth of the degree. That's a school-by-school read.
Best academic tennis colleges, by division
| Program | Acceptance rate | Graduation rate | Median earnings |
|---|---|---|---|
| Harvard University The Ivy League | 4% | 98% | $99,572 |
| University of Pennsylvania The Ivy League | 5% | 97% | $90,555 |
| Columbia University in the City of New York The Ivy League | 4% | 96% | $88,535 |
| Princeton University The Ivy League | 5% | 98% | $87,815 |
| Stanford University Atlantic Coast Conference | 4% | 92% | $102,887 |
| Duke University Atlantic Coast Conference | 6% | 97% | $85,792 |
| Dartmouth College The Ivy League | 5% | 96% | $82,541 |
| Yale University The Ivy League | 4% | 96% | $81,765 |
| Cornell University The Ivy League | 9% | 95% | $87,830 |
| University of Notre Dame Atlantic Coast Conference | 11% | 95% | $86,210 |
Cost
State-funded courts run far cheaper than private ones.
It's natural to assume the bigger divisions charge more and the smaller ones less. The data doesn't bear that out — and a sharper predictor is whether a school is public or private. Across men's tennis, public schools average a net price of $13,605 a year against $27,234 at private ones. (Net price is what a family pays after grants and aid come off the sticker price, not the published cost.)
That roughly $13,600 split between public and private holds inside the divisions, too. In Division I, public schools average $16,051 and privates $32,119; the same divide shows up in D2 ($13,867 public, $24,400 private) and D3 ($15,713 public, $27,795 private). A state university — whether it competes in D1 or D3 — will usually cost a family less than a private college playing in the same division.
Junior college is the standout exception. JUCO programs average just $8,939 net, the lowest entry point in the sport, which makes them a real option for a player who wants two years to sharpen his game and lift his grades before transferring up. These are all averages, and aid packages shift with family income — so the honest move is to run each school's net price calculator rather than trust the division.
Average net price per year, after grant and scholarship aid
A low net price isn't the lesser option — these are the cheapest programs after aid in each level, and at D1 every one is public, led by UT Rio Grande Valley at $5,282 and New Mexico at $6,347. In D3 the CUNY schools anchor the list, with Lehman at $3,961, and junior college runs cheaper still (Imperial Valley at $1,890). Read the price column against graduation rate: the best value keeps both numbers strong, and none of these carry a famous logo.
Best-value tennis colleges, by division
| Program | Net price | Graduation rate |
|---|---|---|
| The University of Texas Rio Grande Valley Southland Conference | $5,282 | 51% |
| University of New Mexico-Main Campus Mountain West Conference | $6,347 | 54% |
| Norfolk State University Mid-Eastern Athletic Conf. | $9,124 | 39% |
| Northern Kentucky University Horizon League | $9,211 | 54% |
| Lamar University Southland Conference | $9,814 | 37% |
| Coppin State University Mid-Eastern Athletic Conf. | $9,831 | 26% |
| Austin Peay State University Atlantic Sun Conference | $9,882 | 39% |
| North Carolina A & T State University Coastal Athletic Association | $10,097 | 57% |
| California State University-Sacramento Big Sky Conference | $10,110 | 56% |
| University of North Carolina at Chapel Hill Atlantic Coast Conference | $10,154 | 91% |
Division averages set expectations; your family needs actual figures for actual schools. A recruiting plan lines up target programs against your budget and aid picture, so you can see which divisions and which schools are genuinely within reach before a coach ever calls.
Resources
At D1, the bigger half of a tennis budget isn't scholarships — it's courts, coaching, and travel.
A tennis budget splits two ways: athletic scholarships, and everything else — coaching, travel, courts, equipment, and operations. How a program divides those tells you a lot about the level. In Division I, the average program spends $664,251 a year, with $255,501 going to scholarships and $408,750 to the rest. Division II averages $210,527 in total and the NAIA $221,892 — and notably, the average NAIA program puts more toward scholarships ($154,193) than the average D2 program does ($89,164).
Division III stands apart by rule: it awards no athletic scholarships. Its programs spend an average of $79,768 a year, all of it on coaching, travel, and operations rather than aid. A strong D3 offer, then, is an academic and need-based aid conversation, not a tennis-scholarship one — worth understanding before a family counts on an athletic discount the division can't give.
Junior colleges run lean as well, averaging $79,912 in total spend with $33,988 toward scholarships. The point isn't that more spending is better — it's that the spending tells you what kind of financial offer to expect from each level before you ever sit down with a coach.
Average spending per year, by division
Athletic aid per roster spot — a program's scholarship dollars divided across its players — makes the difference concrete. Division I leads by a wide margin at about $25,301 per spot. The NAIA comes next at roughly $11,669, ahead of Division II's $8,069, with JUCO around $3,527. Division III shows nothing here, since it gives no athletic aid by rule. These are division-wide averages, not a quote for any one player — but they explain why a recruit chasing an athletic scholarship faces very different odds depending on where he looks.
Average athletic aid per roster spot, by division
These are the heaviest spenders in each level. Total spend is the whole operation — coaching, travel, courts, facilities; the scholarship column shows how much reaches players as athletic aid. Texas A&M tops D1 and the sport at $4,923,345 a year, though only $448,124 of that is scholarships — most of its budget runs through facilities and travel, a reminder that a big total isn't the same as scholarship money waiting for you. At D3, where no athletic aid is allowed by rule, the scholarship column is blank by design.
Best-resourced tennis programs, by division
| Program | Total spend | Scholarships |
|---|---|---|
| Texas A&M University-College Station Southeastern Conference | $4,923,345 | $448,124 |
| Wake Forest University Atlantic Coast Conference | $2,421,436 | $1,081,875 |
| Texas Christian University Big 12 Conference | $2,262,702 | $671,515 |
| Baylor University Big 12 Conference | $2,196,305 | $783,990 |
| Ohio State University-Main Campus Big Ten Conference | $2,017,924 | $454,166 |
| Vanderbilt University Southeastern Conference | $1,932,844 | $956,740 |
| Clemson University Atlantic Coast Conference | $1,799,877 | $363,358 |
| University of Virginia-Main Campus Atlantic Coast Conference | $1,787,876 | $519,531 |
| Duke University Atlantic Coast Conference | $1,778,280 | $572,967 |
| University of Oklahoma-Norman Campus Southeastern Conference | $1,770,659 | $431,505 |
For most families, the figure that matters isn't the headline budget — it's how a program's money turns into aid, coaching, and a realistic place on the ladder. A $2 million program and a $200,000 one can each be the right answer, depending on the player. Read spend as one signal among several, alongside roster turnover, graduation rate, and net price, rather than on its own.
Conclusion
Set the whole sport side by side and one thread runs through every section: the division label is a weak shortcut. The largest group of programs is D3, not D1. The lowest costs run through public schools and junior colleges, not through any single level. The strongest degrees show up from the Ivy League to Caltech to Hillsdale. And the open spots — close to 2,500 a year across the field by our estimate — sit far wider than the ranked teams imply.
So your family's work isn't to chase a tier. It's to weigh what genuinely differs school to school: how your son's game fits the lineup, what the degree is worth, what a year will really cost, and whether a coach has room the season he'd arrive. The 861 programs here are the raw material. The next step is narrowing them to the few that fit — and reaching those coaches early, before the lines fill.
This report lays out the whole field. A recruiting plan does the rest — matching your son's game, grades, and budget to the specific programs worth contacting, and giving your family a clear order of operations for reaching coaches before the spots fill.
Methodology
Roster sizes and program spending come from the Equity in Athletics Data Analysis (EADA) reports that colleges file with the U.S. Department of Education — the source for squad counts, scholarship dollars, and total program expenses. Cost, graduation rates, post-college earnings, and acceptance rates come from the College Scorecard and IPEDS, the federal datasets that track what students pay and how they fare after enrolling. Estimated yearly openings are our own calculation, dividing average roster size by four (by two for two-year junior colleges) to approximate normal class turnover; they describe the typical case, not a guarantee of an open spot at any one program.
Every figure is computed within men's tennis specifically — division by division — so the comparisons reflect this sport rather than college athletics at large. Where a school reported no value for a metric, we left it out of that calculation rather than guess. The data reflects the most recent public reporting available as of the 2025–26 cycle.
U.S. Department of Education. Athletic participation and program finances, filed annually by every college.
U.S. Department of Education. Cost, graduation, earnings, and admissions data.
Official season records and results for NCAA D1, D2, and D3.