By GetRecruited
Introduction
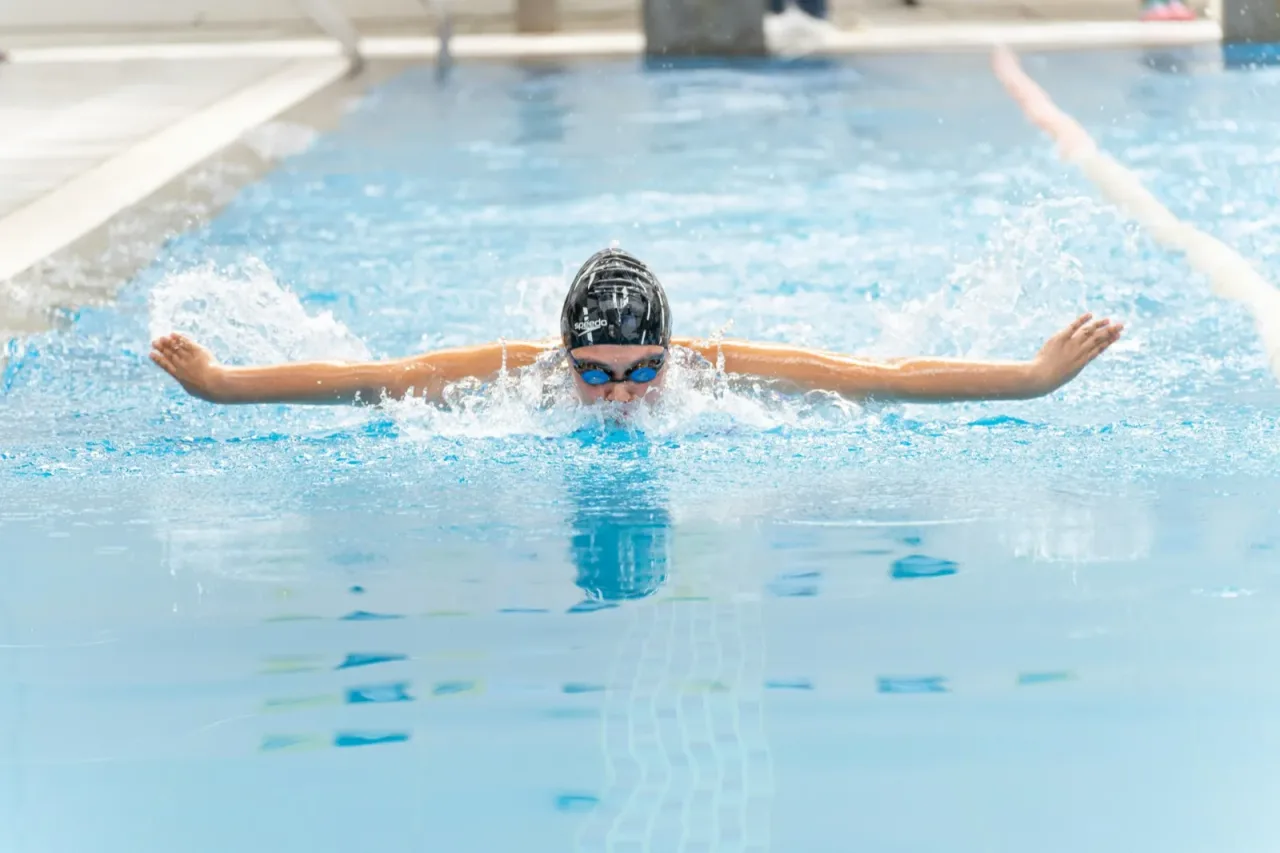
Most of a swimmer's year is spent where no one is watching — a 5 a.m. warm-up, a long afternoon set, a dive drilled until the entry barely breaks the water, all of it pointed at a championship meet that comes down to a few hundredths on the clock. The recruiting works the same quiet way. Coaches aren't out chasing a name; they're reading time drops and meet sheets, hunting for the swimmer who can cover an event their graduating seniors are about to leave empty.
That should change how a family runs the search. The program that genuinely wants your daughter may sit at a school you've never said out loud, in a division you weren't picturing, several states from home. None of that shows up if you only look at the pools you can already name.
What a coach is really replacing is an event, not a swimmer — so the question isn't whether your daughter is fast enough for a famous program, but which of the 395 needs exactly what she swims.
Best colleges
Search for best swimming and diving colleges and you'll get a ranking. Recruiting doesn't work that way. The best swimming and diving college is the one where your level, your grades, your budget, and a real shot at playing time all line up at once — and that school is different for every recruit.
So treat the sections below as filters, not a leaderboard. Each one sorts the field by a single thing that decides fit — how the divisions break down, how fast rosters turn over, what the degree is worth, and what a year really costs — and the full women's swimming & diving directory lets you weigh them against your own priorities, program by program.
Seeing the whole sport is the first step. The work is narrowing it to the programs that fit her times, her grades, and what your family can pay. A recruiting plan turns this map into a ranked list with an order to reach out.
Landscape
Fewer than half the teams swim in D1.
Division I is the level families picture first, and it is the single largest one — 171 programs, 43% of the sport. But that still leaves the majority of pools outside it. Division III sits close behind at 139 programs (35%), then 45 at Division II (11%), 31 at the two-year junior-college level (8%), and 9 in the NAIA (2%), the association of mostly smaller private colleges that hold their own championships.
So more than half of women's swimming and diving is raced below D1. A family that only studies the programs it can name is stepping past the 224 teams where most of the recruiting room actually sits. The level beside a program's name doesn't grade the swimming — it tells you the scholarship rules, the roster math, and the kind of school the pool is attached to.
Which is why the first move isn't to rank the five levels against each other. It's to lay them all out, then let your daughter's times, her grades, and how far from home she'll travel do the sorting.
Where there are colleges, there are pools. California leads with 54 programs and New York follows at 45 — both simply dense with schools. Massachusetts (25), Ohio (23), and Pennsylvania (22) come next, and the upper Midwest carries real weight through Minnesota (16), Michigan (14), and Wisconsin (14).
The top five states together hold 43% of every program, and that bunching has a practical edge: it sets how far your family will drive — for recruiting trips now, for meets later. A swimmer near the Northeast corridor can reach dozens of programs within a few hours; one in a thinner state will need to widen the radius or plan to fly. Worth knowing before you decide how far out to look.
Roster size
What opens is an event, not a bench seat.
A swimming and diving squad has no bench to climb. When a senior who anchored the 100 back or the 3-meter board graduates, that scoring slot goes empty, and refilling it is the opening your daughter is really competing for. Rosters average 26.7 across the sport and run deeper at the top — about 31 at D1, 27 at D2, 24 at D3, 22 in the NAIA, and 16 at the junior-college level.
The number worth asking about isn't how many athletes a team carries; it's how many seats come free each year. Working from a rough rule — about a quarter of a roster turning over annually, half at junior colleges where most athletes stay two years — that comes to roughly 7.8 openings a year at a typical D1 program, 6.7 at D2, 6 at D3, 5.4 in the NAIA, and 7.8 at a JUCO.
Totaled across the country, the sport opens around 1,327 D1 spots a year, 838 at D3, 301 at D2, 242 at the JUCO level, and 49 in the NAIA. These are estimates — a transfer, a fifth-year return, or a thin recruiting class all move the count. But they show the room isn't pooled in one division. It's spread across all five, event by event, every spring.
| Division | Programs | Avg roster | Open spots, total | Open spots, pr. program |
|---|---|---|---|---|
| D1 | 171 | 31.0 | 1,327/year | 7.8/year |
| D2 | 45 | 26.7 | 301/year | 6.7/year |
| D3 | 139 | 24.1 | 838/year | 6.0/year |
| NAIA | 9 | 21.6 | 49/year | 5.4/year |
| JUCO | 31 | 15.6 | 242/year | 7.8/year |
The average buries how far rosters spread inside a single division. Texas A&M carries 53 swimmers and divers in D1; Pennsylvania Western fields 65 in D2, while the leanest programs at the same levels sit in the single digits. A deep roster isn't automatically more opportunity — it can mean more athletes competing for the same events and scoring slots. The figure worth checking is a specific program's roster against the size of its last recruiting class.
Best swimming and diving roster opportunities, by division
| Program | Roster |
|---|---|
| Texas A&M University-College Station Southeastern Conference | 53 |
| Virginia Polytechnic Institute and State University Atlantic Coast Conference | 49 |
| Lafayette College Patriot League | 48 |
| University of South Carolina-Columbia Southeastern Conference | 48 |
| Southern Illinois University-Carbondale Missouri Valley Conference | 47 |
| Auburn University Southeastern Conference | 46 |
| Florida State University Atlantic Coast Conference | 45 |
| Indiana University-Bloomington Big Ten Conference | 43 |
| Loyola University Maryland Patriot League | 43 |
| University of Vermont America East Conference | 43 |
Academics
The classroom holds up well below the D1 line.
It's tempting to assume the strongest classrooms ride with the highest athletic division. The graduation rate — the share of students who finish their degree — doesn't back that up. D1 averages 74% and D3 averages 73%, nearly level, with D2 at 56%, the NAIA at 59%, and the junior-college level at 42%, where many students transfer on to four-year schools rather than finishing where they started. First-year retention, the share who come back for a second year, follows the same shape: 87% at D1, 84% at D3, 77% at D2.
The named programs make it concrete. Among D1 schools, three Ivy League programs sit at the top — Princeton graduates 98% of its students at a net price of $15,313, what a family pays per year after grants and aid; Harvard graduates 98% at $17,525; Penn graduates 97%. None award athletic scholarships, but their financial aid runs deep.
Drop below D1 and the academic strength keeps appearing. At D3, Caltech graduates 94% of its students and posts six-year-after-entry earnings of $132,140, while MIT and the University of Chicago each graduate 96%. In D2, Hillsdale College graduates 90%. The pattern holds the whole way down: a serious degree isn't something a family trades away to swim at a smaller level.
Best academic swimming and diving colleges, by division
| Program | Acceptance rate | Graduation rate | Median earnings |
|---|---|---|---|
| Harvard University The Ivy League | 4% | 98% | $99,572 |
| University of Pennsylvania The Ivy League | 5% | 97% | $90,555 |
| Princeton University The Ivy League | 5% | 98% | $87,815 |
| Columbia University in the City of New York The Ivy League | 4% | 96% | $88,535 |
| Stanford University Atlantic Coast Conference | 4% | 92% | $102,887 |
| Duke University Atlantic Coast Conference | 6% | 97% | $85,792 |
| Dartmouth College The Ivy League | 5% | 96% | $82,541 |
| Yale University The Ivy League | 4% | 96% | $81,765 |
| Cornell University The Ivy League | 9% | 95% | $87,830 |
| University of Notre Dame Atlantic Coast Conference | 11% | 95% | $86,210 |
Cost
The four-year cost tracks the institution, not her events.
The number to anchor the search on is net price — what your family actually hands over each year after grants and scholarships, not the sticker figure on the website. And the split that moves it most isn't the division. It's whether the school is public or private. Public programs average $15,162 a year after aid; private ones average $29,616. That roughly $14,000 gap is wider than the distance between any two divisions.
Look inside each level and the same divide repeats. At D1, a public school averages $17,008 against a private school's $32,399; at D3, it's $15,403 public versus $29,430 private. The division barely nudges the bill — the funding model swings it. A state university, whether it swims D1 or D3, usually costs a family less than a private college in the same division.
The full range is wide. Junior colleges average just $8,347 a year, the lowest of any level, while private programs near the top can run past $30,000. Where a program sits on that spread — and whether its aid can close the gap for you — belongs near the front of the search, not the end.
Average net price per year, after grant and scholarship aid
There's a quiet assumption that the cheap option is the lesser one. The programs below are the counter-evidence — the lowest net prices in each division, after grants and aid. UT Rio Grande Valley leads D1 near $5,282; at D3, CUNY Lehman and the U.S. Merchant Marine Academy sit close to $4,000. Almost all are public, and several pair that low bill with genuinely strong academics.
Best-value swimming and diving colleges, by division
| Program | Net price | Graduation rate |
|---|---|---|
| The University of Texas Rio Grande Valley Mountain Pacific Sports Federation (Women’s Swimming and Diving) | $5,282 | 51% |
| University of New Mexico-Main Campus Mountain West Conference | $6,347 | 54% |
| California State University-Bakersfield Big West Conference | $6,489 | 50% |
| California State University-Fresno Mountain West Conference | $7,834 | 57% |
| Marshall University American Conference | $8,076 | 51% |
| Northern Kentucky University Horizon League | $9,211 | 54% |
| University of North Carolina at Chapel Hill Atlantic Coast Conference | $10,154 | 91% |
| Florida Atlantic University American Conference | $10,225 | 63% |
| New Mexico State University-Main Campus Mountain Pacific Sports Federation (Women’s Swimming and Diving) | $10,719 | 55% |
| University of Illinois Chicago Missouri Valley Conference | $10,852 | 62% |
A program reads differently once you can see what it would cost your family and what its degree returns. A recruiting plan lines those figures up against her times and grades, so the list she chases is one you can afford to finish.
Resources
Most scholarship money sits at D1 and fades below.
Program spending falls into two buckets: athletic scholarships, and everything else — coaching, travel, facilities, meet costs. The totals drop sharply by level. An average D1 program spends about $1,185,227 a year, with $875,559 of that going to scholarships. D2 spends roughly $382,753 total ($267,647 in scholarships), and the NAIA $261,837 ($199,342 in scholarships). At the junior-college level, spending averages $139,773, with $45,654 in scholarships.
Division III is the exception by rule: it awards no athletic scholarships at all. A D3 program's roughly $137,304 in annual spending runs the team — coaching, travel, pool time — rather than paying athletes. That doesn't make D3 costly; recall those net prices, which financial and academic aid bring down. The money simply reaches a swimmer through a different door.
Average spending per year, by division
What matters to your family isn't a program's total spend — it's how much athletic aid lands on a single swimmer. Divide scholarship dollars by roster spots and the levels separate cleanly: a D1 program puts about $28,445 behind each spot, D2 about $10,021, the NAIA about $9,000, and the junior-college level about $1,930. D3, awarding no athletic aid, reaches its swimmers through need-based and academic grants instead.
Those are averages, and athletic aid rarely spreads evenly — a coach may load it onto a few priority recruits and leave others on little or none. Read the per-spot figure as how much room a level has to fund a swimmer, then ask each coach directly what an actual offer would look like for your daughter.
Average athletic aid per roster spot, by division
These are the heaviest spenders in each division — the programs putting the most into their women's swimming and diving each year. Total spend is the whole operation; the scholarship column shows how much of it reaches athletes directly, the line between a facilities-and-travel budget and a scholarship-first one. At the D1 top, Tennessee runs past $3.7 million a year, most of it outside scholarships — the flights, the meets, the training centers.
Best-resourced swimming and diving programs, by division
| Program | Total spend | Scholarships |
|---|---|---|
| The University of Tennessee-Knoxville Southeastern Conference | $3,745,540 | $1,356,798 |
| Rutgers University-New Brunswick Big Ten Conference | $2,896,784 | $1,116,505 |
| Auburn University Southeastern Conference | $2,853,842 | $1,683,036 |
| University of Michigan-Ann Arbor Big Ten Conference | $2,772,733 | $1,259,080 |
| The University of Texas at Austin Southeastern Conference | $2,735,782 | $1,015,987 |
| Stanford University Atlantic Coast Conference | $2,642,480 | $1,305,939 |
| Indiana University-Bloomington Big Ten Conference | $2,618,237 | $1,292,671 |
| University of Florida Southeastern Conference | $2,561,428 | $1,231,480 |
| University of Notre Dame Atlantic Coast Conference | $2,541,452 | $1,523,102 |
| Texas A&M University-College Station Southeastern Conference | $2,527,433 | $1,437,957 |
The point isn't to chase the largest budget. It's to read each program's spending for what it actually tells you — how much aid a level can put behind a swimmer, and how much of the money is simply the price of competing far from home. Both belong in the conversation; neither decides whether your daughter will be happy there.
Conclusion
Lay the whole sport out and one lesson keeps returning: the division beside a program's name settles less than families expect. Strong degrees show up at D1 and D3 alike. The price hinges on whether a school is public or private, not on its level. The open spots are scattered across all five divisions, event by event, every spring.
What does decide things is fit — a program that needs her events, a school your family can afford, a degree worth the four years, a distance you can live with. The 395 programs here are the field. The work now is matching the few that suit your daughter against the times she can post and the grades she carries.
Begin with what your family actually needs, and let the data steer you toward the programs that meet it. The field is laid out; the choosing is yours.
A list of pools isn't a strategy. The next step is shaping these 395 programs into a ranked, realistic shortlist — matched to her times, her grades, and what your family can pay — with a clear order for reaching out. That's the work a recruiting plan does.
Methodology
Roster sizes and program finances — scholarship dollars and other operating costs — come from the Equity in Athletics Disclosure Act (EADA), the federal filing every college with an athletics program submits each year. Cost, graduation rates, first-year retention, post-college earnings, and admissions figures come from the U.S. Department of Education's College Scorecard and IPEDS. Net price is the average a family pays per year after grants and scholarships; earnings reflect what graduates make roughly six years after entering college.
Every figure is calculated within women's swimming and diving and broken out by division, so comparisons stay inside the sport rather than across unlike ones. Estimated open spots apply a standard turnover assumption to average roster size — a quarter per year at four-year programs, half at junior colleges — and are honest approximations, not guarantees of a given team's openings in a given year. Data reflects the most recent reporting available as of the 2025-26 cycle.
U.S. Department of Education. Athletic participation and program finances, filed annually by every college.
U.S. Department of Education. Cost, graduation, earnings, and admissions data.
Official season records and results for NCAA D1, D2, and D3.